
Lectures
All lectures and materials can be found on the homepage of the institute. A password, which you receive by attending the corresponding lecture, is required to access the respective materials.
Learning Potential
This page can be used by all students at the University who are interested in undertaking either bachelor, master or PhD. positions in the Laschat Research Group. Here you'll find a summary of the wide range of analytical methodologies that we use here in the group for characterisation of molecular structure and physical characteristics. For each method, you'll find a short explanation of what the technique can be used for with respect to our research:
-
Structural information: NMR spectra
-
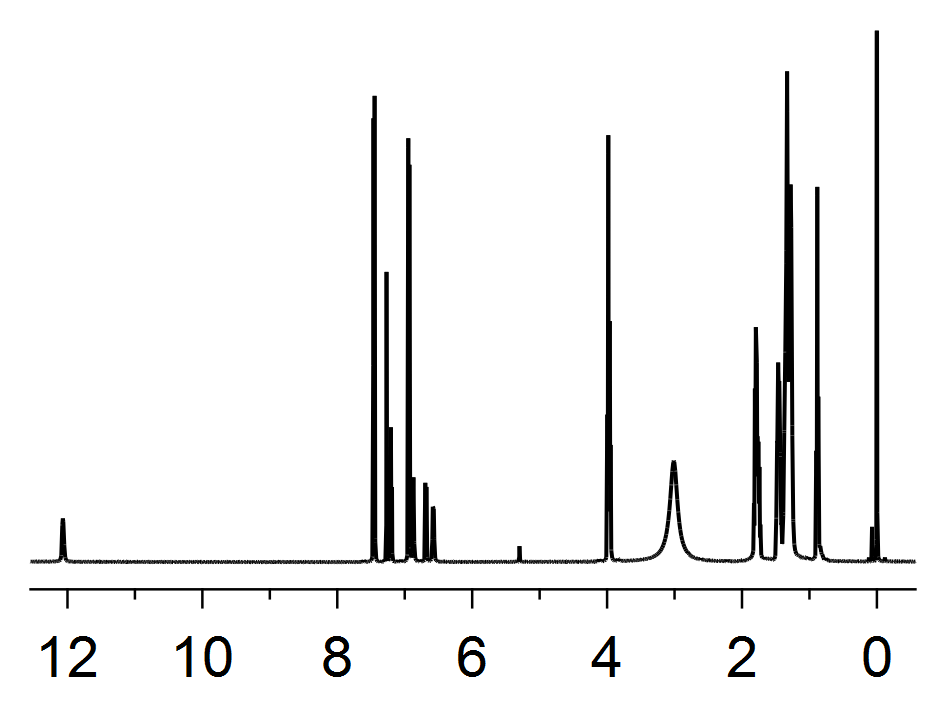
1H-NMR spectra
1H-proton NMR spectra are an important indicator for the determination of the chemical structure. Depending on the electron density, anisotropic and steric effects, different protons exhibit characteristic chemical shifts δ.[1] Our analytical department posesses NMR spetrometers of 300, 400, 500 and 700 MHz. The 300 and 400 MHz spectrometer is set up for open acess for all master and PhD. students.
-
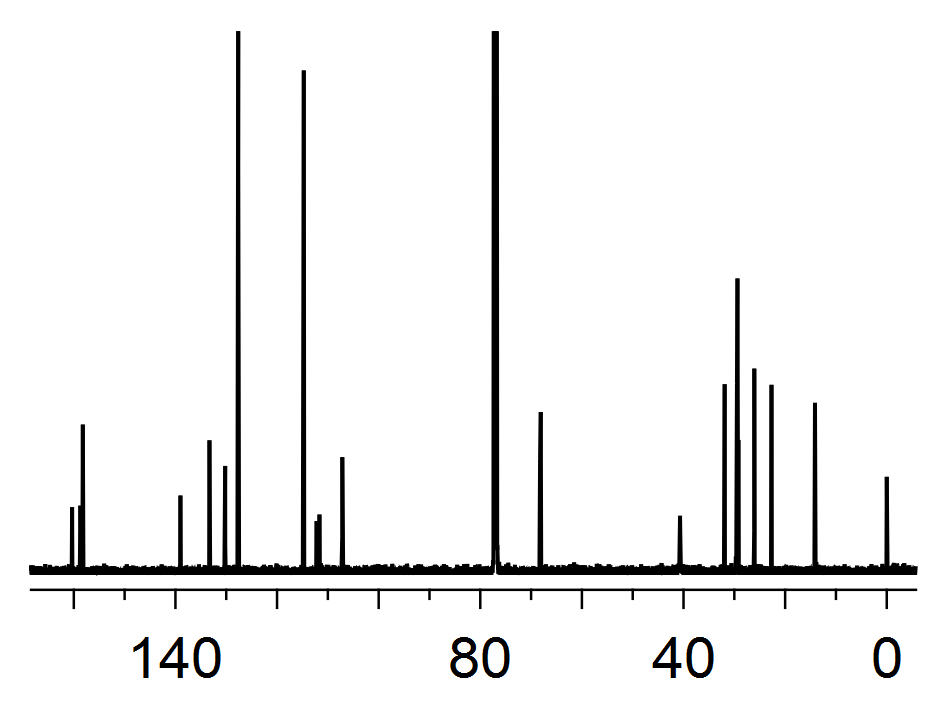
13C-NMR spectra
In combination with 1H-NMR spectra, proton decoupled 13C-NMR spectra are an efficient tool for the characterization of simple organic compounds. Both 1H and 13C are part of the full characterization one has to do for newly synthesized derivatives. Further important literature for NMR spectroscopy are the table of NMR impurities[2] and articles concerning the analysis of multiplets.[3]
-
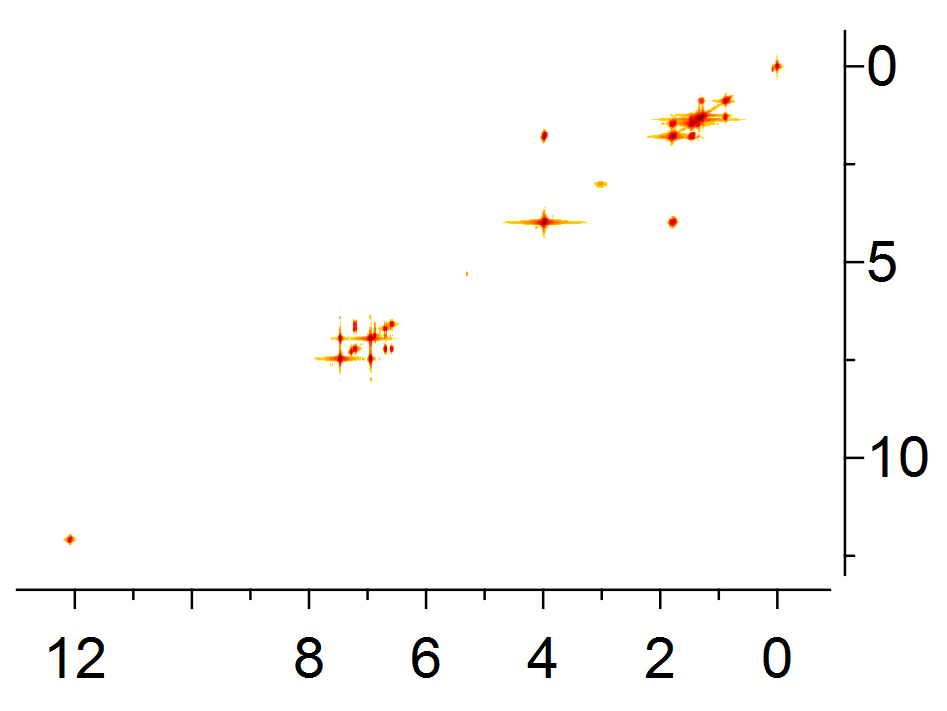
2D-NMR spectra
When more complex compounds are measured, combinations of 1H- and 13C-NMR spectra, so called 2 dimensional spectrums, are recorded. Numerous varieties of 2D-NMR spectra such as e.g. COSY (COrrelationSpectroscopY), HSQC (Heteronuclar Single Quantum Coherence), HMBC (Heteronuclear Multiple Bond Correlation) and NOESY (Nuclear Overhauser Enhancement SpectroscopY) can give information about correlations between different protons or between protons and carbon atoms over both short and long range distances.
-
[1] M. Hesse, Spektroskopische Methoden in der organischen Chemie, Georg Thieme Verlag, 2011.
[2] H. E. Gottlieb, V. Kotlyar, A. Nudelman, J. Org. Chem. 1997, 62, 7512–7515.
[3a] T. R. Hoye, P. R. Hanson, J. R. Vyvyan, J. Org. Chem. 1994, 59, 4096–4103.
[3b] T. R. Hoye, H. Zhao, J. Org. Chem. 2002, 67, 4014–4016.
Liquid crystalline properties
-
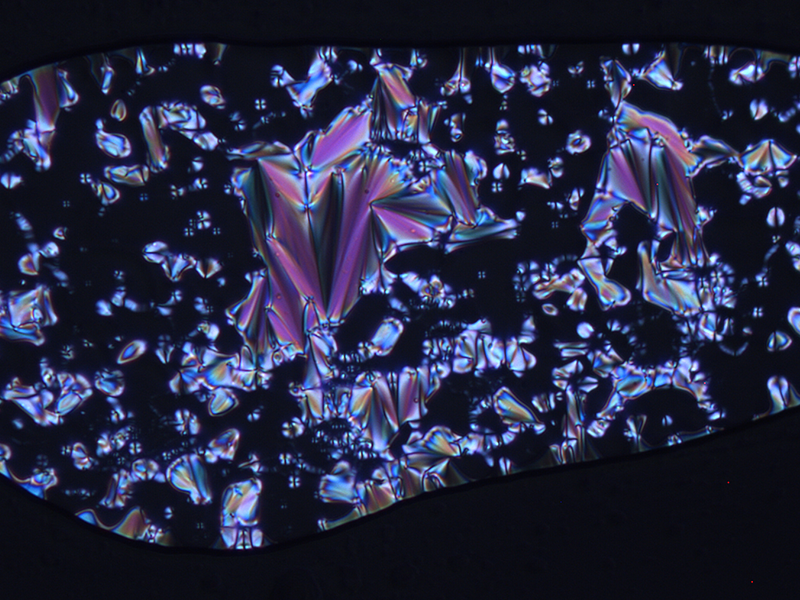
Polarized microscopy
A characteristic feature of liquid crystalline substances is birefringence. This means that the plane of linear polarized light is tilted by a specific angle due to anisotropy. When observing birefringence under a polarized optical microscope (POM), in which the sample is placed between two polarizators, which are oriented perpendicular to one another, colored textures appear. These textures are fluid due to the liquid crystalline state and change with time. The shape and general behaviour of POM textures is a first indicator for the type of liquid crystalline state.[4, 5]
-
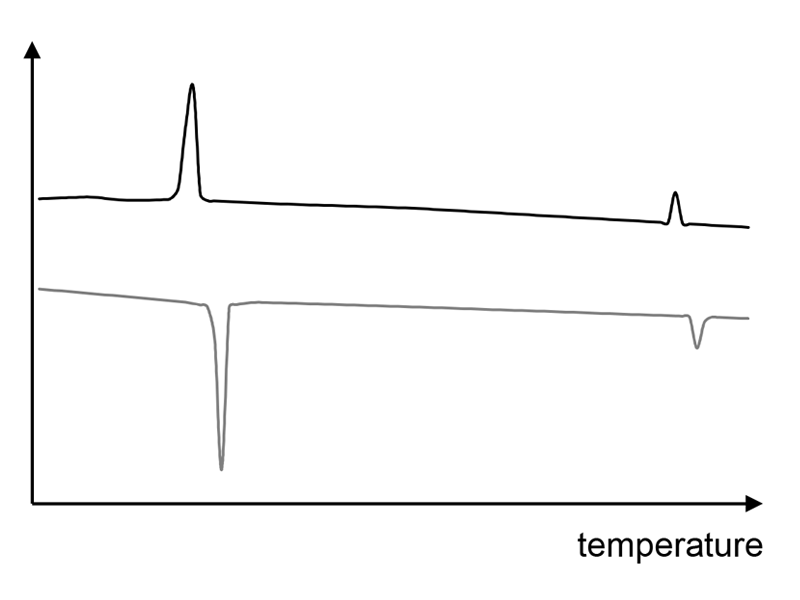
Differential scanning calorimetry
Phase transitions can be investigated by differential scanning calorimetry. By heating a sample slowly in comparison to a reference, specific phase transitions due to changes in temperature and their corresponding enthalpies can be measured.[6]
-
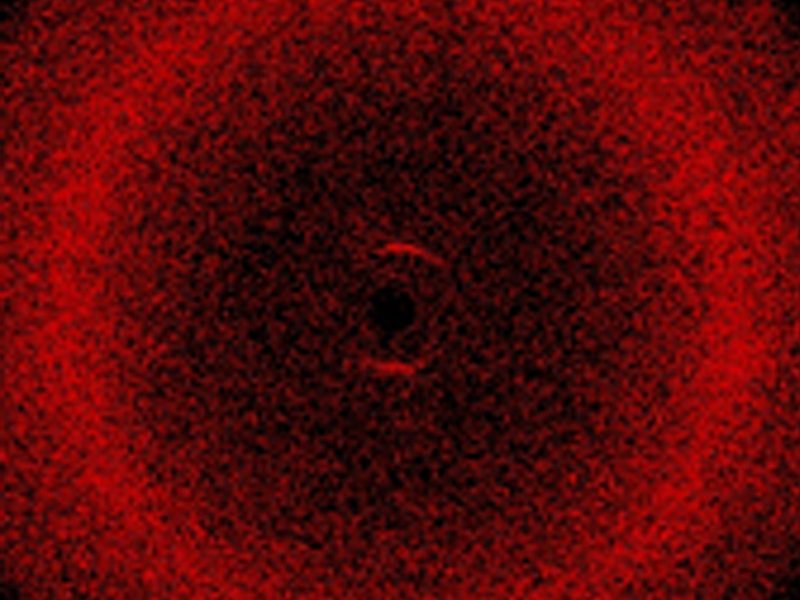
X-ray diffraction
X-ray diffraction measurements are a powerful tool for gaining detailed information about the liquid crystalline state. According to bragg's equation, X-rays are diffracted within the sample and interfere with one another in case of symmetry.[7] This symmetry can be caused by a periodic molecular arrangement as it is known in crystals or liquid crystals. Constructive interference of X-rays leads to diffration images (see image on the right), the analysis of which gives detailed information about the mesophase type.[8]
-
[4] H. J. Paus, Physik in Experimenten und Beispielen, Hanser Verlag, 2007.
[5] I. Dierking, Textures of Liquid Crystals, John Wiley & Sons, 2003.
[6] A. Frick, C. Stern, DSC-Prüfung in der Anwendung, Hanser Verlag, 2006.
[7] P. W. Atkins, E. D. T. Atkins, J. D. Paula, Physikalische Chemie, Wiley VCH Verlag GmbH, 2013.
[8] L. M. Blinov, Structure and Properties of Liquid Crystals, Springer, 2010.
Analysing properties of dyes
-
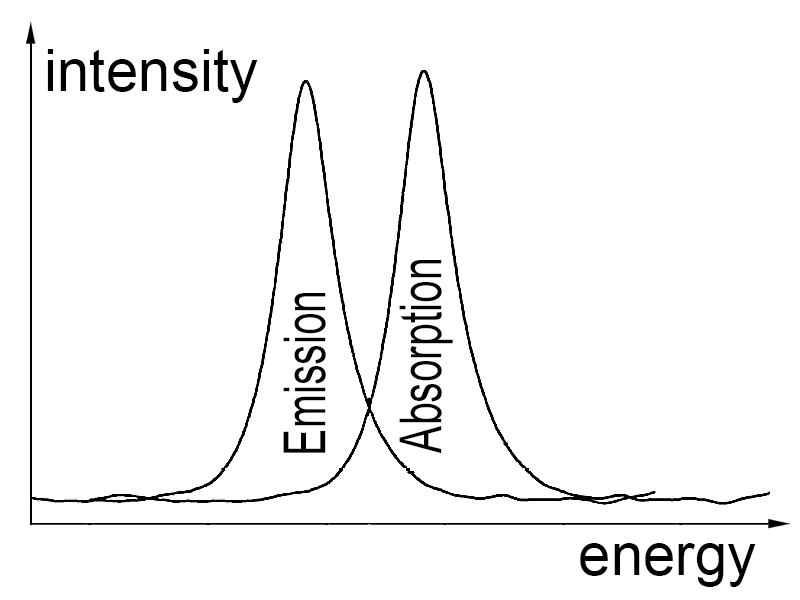
UV/Vis
Molecules with chromophores such as conjugated π-systems are able to absorb light. By absorbing a photon, the molecules' electronic wave function is changed to an excited state. In addition, several vibrational states can be excited. By vibrational relaxation induced by molecular impacts and solvent reorientation, the energy of the excited state can be lowered. After a few nanoseconds, the absorbed energy can be released via fluorescence which means that a photon is released. The distribution and maximum of the absorption are the factors which determine any compounds' color.
-
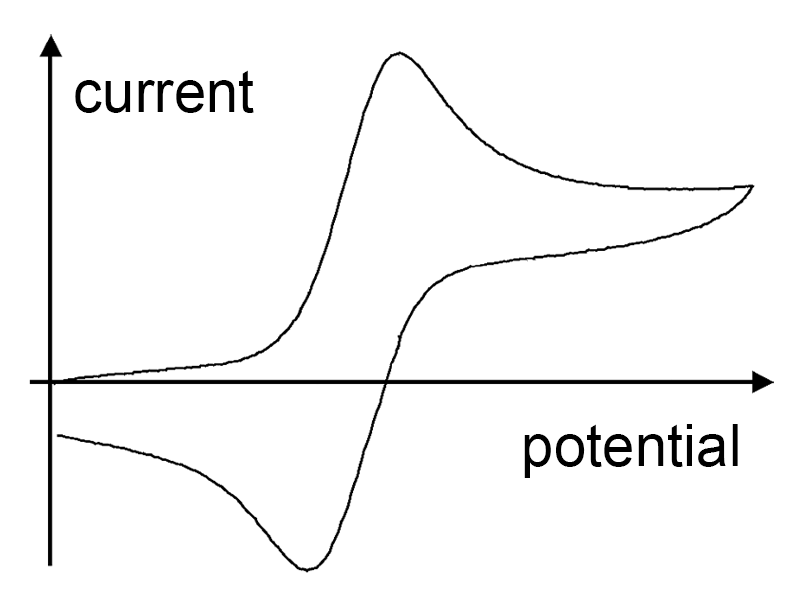
Cyclic Volltametry measurements
Further information about the electronic structure of dyes can be provided by cyclic voltammetry. This solution-based method uses a linear ramp of the electrode potential. By splitting the current at the working electrode versus the applied voltage, a cyclic voltamogramm trace can be obtained. This curve shows the reproducibility of an oxidation an reduction of the compound. Additionally, the energies of the HOMO and LUMO orbitals can be determined, giving important information about possible applications.